par Banyan Gold Corp. (CVE:BYN)
Banyan Announces First Indicated Mineral Resources and Identifies High Grade Continuous Zones at Its’ AurMac Project, Yukon, Canada
VANCOUVER, BC / ACCESS Newswire / July 8, 2025 / Banyan Gold Corp . (the " Company " or " Banyan ") (TSXV:BYN)(OTCQB:BYAGF) is pleased to announce the first Indicated Mineral Resources with the updated Mineral Resource Estimate (the " MRE " or the " Mineral Resource ") prepared in accordance with National Instrument 43-101, Standards for Disclosure for Mineral Projects (" NI 43-101 ") for the AurMac Project (" AurMac " or the " Project "), Yukon Territory. The updated MRE incorporates an additional 21,000 metres (" m ") from 118 diamond drillholes collared within the Airstrip and Powerline deposits of AurMac completed in 2024 (Figure 1). AurMac is road accessible and is transected by an existing transmission line of the Yukon's power grid.
"Within the sensitivity table, the contiguous higher-grade zones are highlighted with 1.42 Moz of Indicated Mineral Resources at 0.95 g/t (46.4 M tonnes) and 3.13 Moz of Inferred Mineral Resources at an average gold grade of 0.98 g/t (99.2 M tonnes) , at the 0.55 g/t gold cut off," stated Tara Christie, President and CEO. "This update achieved the primary objectives of last year's program, which were to convert over 2 million ounces into Indicated Mineral Resources with a refined geological model and importantly identify near surface, high-grade areas."
The updated MRE comprises an Indicated Mineral Resource of 2.274 million (" M ") ounces (" oz ") of gold (" Au ") (112.5 M tonnes at 0.63 g/t) and an Inferred Mineral Resource of 5.453 Moz of Au ( 280.6 M tonnes at 0.60 g/t ) (as defined in the Canadian Institute of Mining, Metallurgy and Petroleum (" CIM ") Definition Standards for Mineral Resources & Mineral Reserves incorporated by reference into NI 43â101). The updated MRE is summarized below in Table 1 (Figure 1) . The AurMac Project pit constrained MRE is contained in two near/on-surface deposits: The Airstrip and Powerline deposits.
Table 1: Pit-Constrained Indicated and Inferred Mineral Resources - AurMac Project
Indicated MRE | Inferred MRE | ||||||
Deposit | Au Cut-Off Grade (g/t) | Tonnage | Gold Grade (g/t) | Gold Content | Tonnage | Gold Grade (g/t) | Gold Content |
Airstrip | 0.30 | 27.7 | 0.69 | 0.611 | 10.1 | 0.75 | 0.245 |
Powerline | 0.30 | 84.8 | 0.61 | 1.663 | 270.4 | 0.60 | 5.208 |
Total Combined | 0.30 | 112.5 | 0.63 | 2.274 | 280.6 | 0.60 | 5.453 |
Notes to Table 1 :
The effective date for the MRE is June 28, 2025.
Mineral Resources which are not Mineral Reserves do not have demonstrated economic viability. The estimate of Mineral Resources may be materially affected by environmental, permitting, legal, title, taxation, sociopolitical, marketing,changes in global gold markets or other relevant issues.
The CIM Definition Standards were followed for classification of Mineral Resources. The quantity and grade of reported Inferred Mineral Resources in this estimation are uncertain in nature and there has been insufficient exploration to define these Inferred Mineral Resources as an Indicated Mineral Resource.
Mineral Resources are reported at a cut-off grade of 0.30 g/t gold for all deposits, using a US$/CAN$ exchange rate of 0.73 and constrained within an open pit shell optimized with the Lerchs-Grossman algorithm to constrain the Mineral Resources with the following estimated parameters: gold price of US$2,050/ounce, US$2.50/t mining cost, US$10.00/t processing cost, US$2.00/t G+A, 90% gold recoveries, and 45° pit slopes. 1
The number of tonnes and ounces was rounded to the nearest thousand. Any discrepancies in the totals are due to rounding effects.
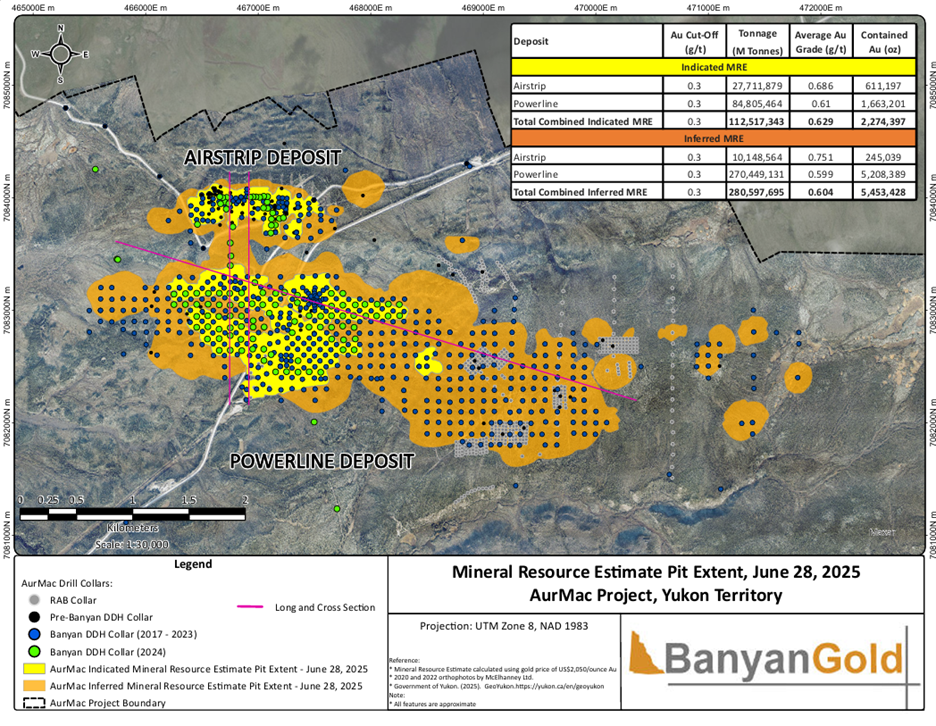
Figure 1. Plan Map Showing the Mineral Resource Estimate and Drill Collar Locations
A technical report prepared in accordance with NI 43-101 supporting the updated Mineral Resource (the " Technical Report ") will be filed on SEDAR at www.sedarplus.ca within 45 days of this release. The pit outlines used to constrain the MRE are shown in Figure 1. Additional information on the AurMac Project and a 3-D visualization can be found at: https://www.banyangold.com
Powerline Deposit
The drill data for the Powerline deposit is comprised of 1,043 drill holes, representing an increase of 89 holes from the February 6, 2025 MRE (originally published in 2024).
A new geology model was developed at Powerline by the Banyan geology team for this mineral resource update. The updated model uses lithologic units identified through geochemical variations, to constrain mineralization. This new model differs from the extents of mineralized envelopes previously used at Powerline; which Banyan Management feels is an improvement on the original geologic model; refined and updated based on additional diamond drilling across the Project.
Powerline mineralization is predominantly hosted in 1-3 (up to 25) cm-thick quartz veins. Veins in Powerline associated with gold mineralization are discordant relative to stratigraphy and main foliation, with an average of 14° toward an azimuth of 338° and are interpreted as younger, cross-cutting features. Certain lithologic domains, which are favourable hosts for quartz veining, are interpreted to act as a broad control on mineralization. Detailed analysis of structural and geochemical controls on mineralization as well as interpretation of vein systems are ongoing following infill drilling from 2024, with the goal of further refinement of the geologic model for Powerline.
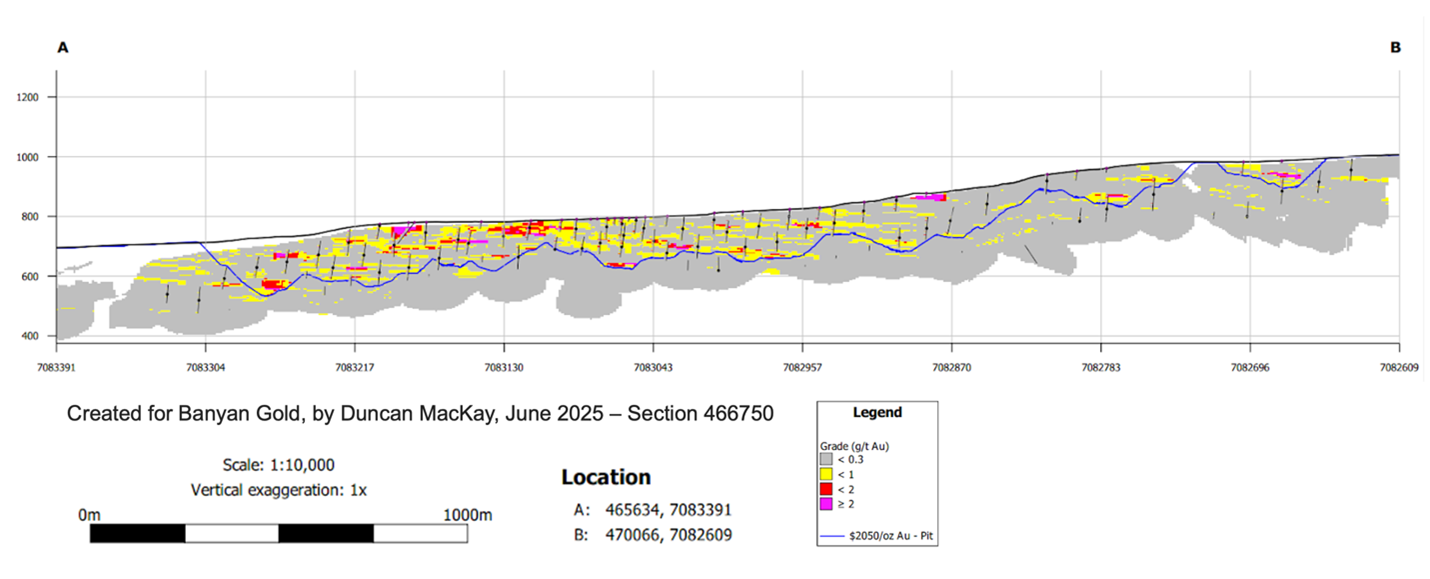
Figure 2: Long Section through Powerline MRE block model. Several continuous mineralized zones >1 g/t Au are present near surface in the central and western portion of the deposit. Resource blocks are 10 m x 10 m x 5 m. Only blocks >0.3 g/t Au cutoff and within the $2,050/oz Au pit shell are included in the MRE.
The most common sampling length of the Powerline deposit is 1.5 m, accounting for approximately 20% of the sample data and is the composite length; over 60% of samples are equal to or below the composite length. Capping of high-grade outliers was carried out for each mineralized zone and ranged from 1.7 g/t gold to 17.0 g/t gold.
The estimation of gold grades into a block model was carried out with the Ordinary Kriging (" OK ") technique on capped composites with the resultant block model comprised of a parent block size of 10 m (easting) x 10 m (northing) x 5 m (elevation) and a sub-block size of 1 m (easting) x 1 m (northing) x 1 m (elevation). Density was calculated from a total of 12,563 measurements from the drill core. The average density per lithology type was assigned to the corresponding blocks.
At a 0.30 g/t gold cut-off, the pit-constrained, Indicated Mineral Resources for Powerline are 84.8 million tonnes at an average gold grade of 0.61 g/t for a total of 1,663,000 ounces of gold and Inferred Mineral Resources for Powerline are 270.4 million tonnes at an average gold grade of 0.60 g/t for a total of 5,208,000 ounces of gold . Cut-off grade sensitivities for the Powerline deposit are presented in Table 2.
Table 2. Pit-Constrained Indicated and Inferred Mineral Resources - Powerline Deposit
Indicated MRE - Powerline | Inferred MRE - Powerline | |||||
Au Cut-Off Grade (g/t) | Tonnage | Gold Grade | Gold Content | Tonnage | Gold Grade | Gold Content |
0.05 | 231,640,645 | 0.32 | 2,405,516 | 1,032,259,114 | 0.26 | 8,728,416 |
0.10 | 192,538,290 | 0.37 | 2,308,963 | 781,124,091 | 0.32 | 8,136,844 |
0.15 | 157,033,478 | 0.43 | 2,165,911 | 582,100,032 | 0.39 | 7,354,974 |
0.20 | 127,533,445 | 0.49 | 2,000,944 | 444,533,601 | 0.46 | 6,588,651 |
0.25 | 104,035,379 | 0.55 | 1,832,958 | 344,740,385 | 0.53 | 5,863,255 |
0.30 | 84,805,464 | 0.61 | 1,663,201 | 270,449,131 | 0.60 | 5,208,389 |
0.35 | 69,672,238 | 0.67 | 1,505,289 | 212,061,104 | 0.68 | 4,602,097 |
0.40 | 57,562,113 | 0.74 | 1,360,238 | 171,279,758 | 0.75 | 4,113,558 |
0.45 | 47,903,250 | 0.80 | 1,227,480 | 139,241,117 | 0.82 | 3,675,375 |
0.50 | 40,063,877 | 0.86 | 1,109,040 | 116,590,672 | 0.89 | 3,328,647 |
0.55 | 33,827,467 | 0.92 | 1,003,835 | 94,271,177 | 0.97 | 2,952,085 |
0.60 | 28,470,259 | 0.99 | 904,356 | 77,465,386 | 1.06 | 2,642,494 |
0.65 | 24,066,935 | 1.06 | 816,327 | 66,669,747 | 1.13 | 2,426,421 |
0.70 | 20,573,232 | 1.12 | 740,157 | 56,934,605 | 1.21 | 2,214,893 |
0.75 | 17,538,790 | 1.19 | 669,895 | 48,691,460 | 1.29 | 2,022,583 |
0.80 | 15,104,216 | 1.25 | 608,957 | 42,015,950 | 1.38 | 1,857,410 |
0.85 | 13,155,783 | 1.32 | 557,472 | 36,783,461 | 1.45 | 1,718,340 |
0.90 | 11,456,051 | 1.38 | 509,756 | 32,326,323 | 1.53 | 1,593,270 |
0.95 | 10,111,629 | 1.45 | 469,764 | 28,980,449 | 1.60 | 1,493,584 |
1.00 | 8,983,837 | 1.50 | 434,411 | 26,064,344 | 1.67 | 1,401,954 |
Notes to Table 2:
The effective date for the MRE is June 28, 2025.
Mineral Resources, which are not Mineral Reserves, do not have demonstrated economic viability. The estimate of Mineral Resources may be materially affected by environmental, permitting, legal, title, taxation, sociopolitical, marketing, changes in global gold markets or other relevant issues.
The CIM Definition Standards were followed for the classification of Inferred Mineral Resources. The quantity and grade of reported Inferred Mineral Resources in this estimation are uncertain in nature and there has been insufficient exploration to define these Inferred Mineral Resources as an Indicated Mineral Resource.
Mineral Resources are reported at a cut-off grade of 0.30 g/t gold, using a US$/CAN$ exchange rate of 0.73 and constrained within an open pit shell optimized with the Lerchs-Grossman algorithm to constrain the Mineral Resources with the following estimated parameters: gold price of US$2,050/ounce, US$2.50/t mining cost, US$10.00/t processing cost, US$2.00/t G+A, 90% recoveries, and 45° pit slopes.
The number of tonnes and ounces was rounded to the nearest thousand. Any discrepancies in the totals are due to rounding effects.
Airstrip Deposit
The Airstrip deposit is delineated by 151 drill holes, representing an increase of 12 drill holes from the February 6, 2025 MRE (originally published in 2024). Topographic control was from a detailed LIDAR survey dataset.
The Airstrip lithological model is comprised of eight (8) east-west striking units, with six (6) of the units dipping at 35-40° to the south. Gold mineralization is predominantly hosted in two calcareous metasedimentary packages (CAL1 and CAL2 in Figure 3); the upper unit is roughly 90 m-thick east-west striking and dipping approximately 40° to the south, and a lower unit approximately 10 m thick with the same orientation as the upper unit. A felsic dyke intruded the country rock (approximately 10 m-thick with several splays) and strikes approximately 080° and dips 60° to the south. A zone of relatively high-grade gold mineralization is associated with the contact between the calcareous metasediment and the felsic dyke; this zone is near-surface in the north of Airstrip and is open along strike and up-dip, as well as at depth locally.
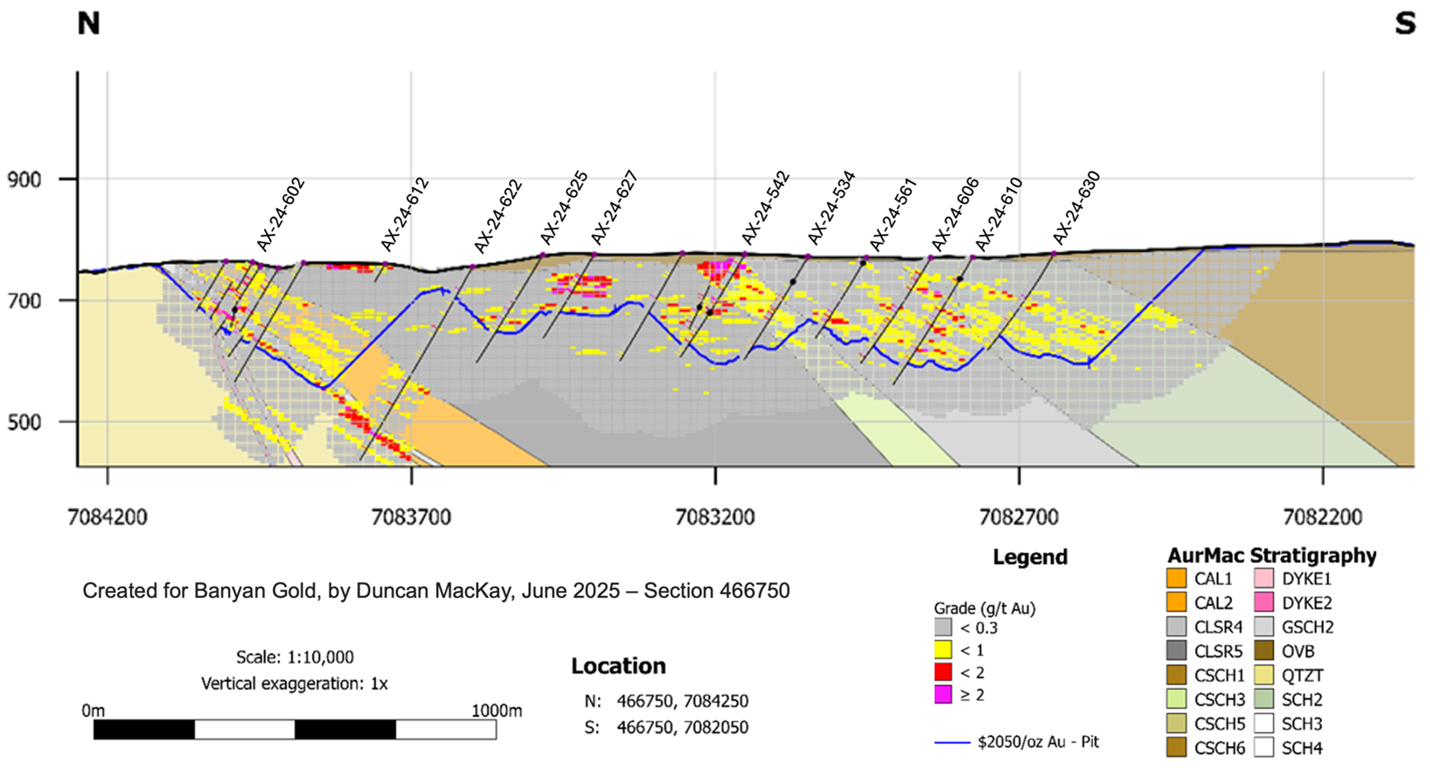
Figure 3: Cross Section through Airstrip (north) and Powerline (south) MRE block model. Several continuous mineralized zones >1 g/t Au are present near surface in the Airstrip and Powerline Deposits. Mineralization is predominantly hosted in calcareous metasedimentary units which are used to constrain the MRE block model. Resource blocks are 10 m x 10 m x 5m. Only blocks >0.3 g/t Au cutoff and within the $2050/oz Au pit shell are included in the MRE.
The most common sampling length of the Airstrip deposit is 1.5 m accounting for approximately 35% of the sample data; all composites were constructed at this interval with >75% of all samples equal to or below this length. Capping of high-grade outliers was based on lithological domains and varied from 0.6 g/t gold to 15.0 g/t gold.
The estimation of gold grades into a block model was carried out with the OK technique on capped composites and the resultant block model comprised of a block size of 10 m (easting) x 10 m (northing) x 5 m (elevation) and sub-block size of 1m (easting) x 1 m (northing) x 1 m (elevation). Density was calculated from a total of 12,563 measurements from the drill core. The average density per lithology type was assigned to the corresponding blocks.
At a 0.30 g/t gold cut-off, the pit-constrained, Indicated Mineral Resources for the Airstrip deposit are 27.7 million tonnes at an average gold grade of 0.69 g/t for a total of 611,000 ounces of gold and Inferred Mineral Resources for the Airstrip deposit are 10.1 million tonnes at an average gold grade of 0.75 g/t for a total of 245,000 ounces of gold . Cut-off grade sensitivities for the Airstrip deposit are presented in Table 3 .
Table 3: Pit-Constrained Indicated and Inferred Mineral Resources - Airstrip Deposit
Indicated MRE - Airstrip | Inferred MRE - Airstrip | |||||
Au Cut-Off Grade (g/t) | Tonnage | Gold Grade | Gold Content | Tonnage | Gold Grade | Gold Content |
0.05 | 58,263,499 | |||||