par IBC Advanced Alloys Corp. (isin : CA44923T8683)
IBC Advanced Alloys Reports Profitability for the Quarter Ended December 31, 2023
Highlights of the Quarter and YTD as Compared to Prior-Year Periods
(Unless otherwise noted, all financial amounts in this news release are expressed in U.S. dollars.)
- IBC swung to profitability in quarter, driven by a 34.1% increase in sales over the prior-year period to $10 million. Copper Alloys division sales of $7 million were higher by 24.1% quarter-over-quarter ("Q/Q") and Engineered Materials division sales of $3 million increased by 66% Q/Q.
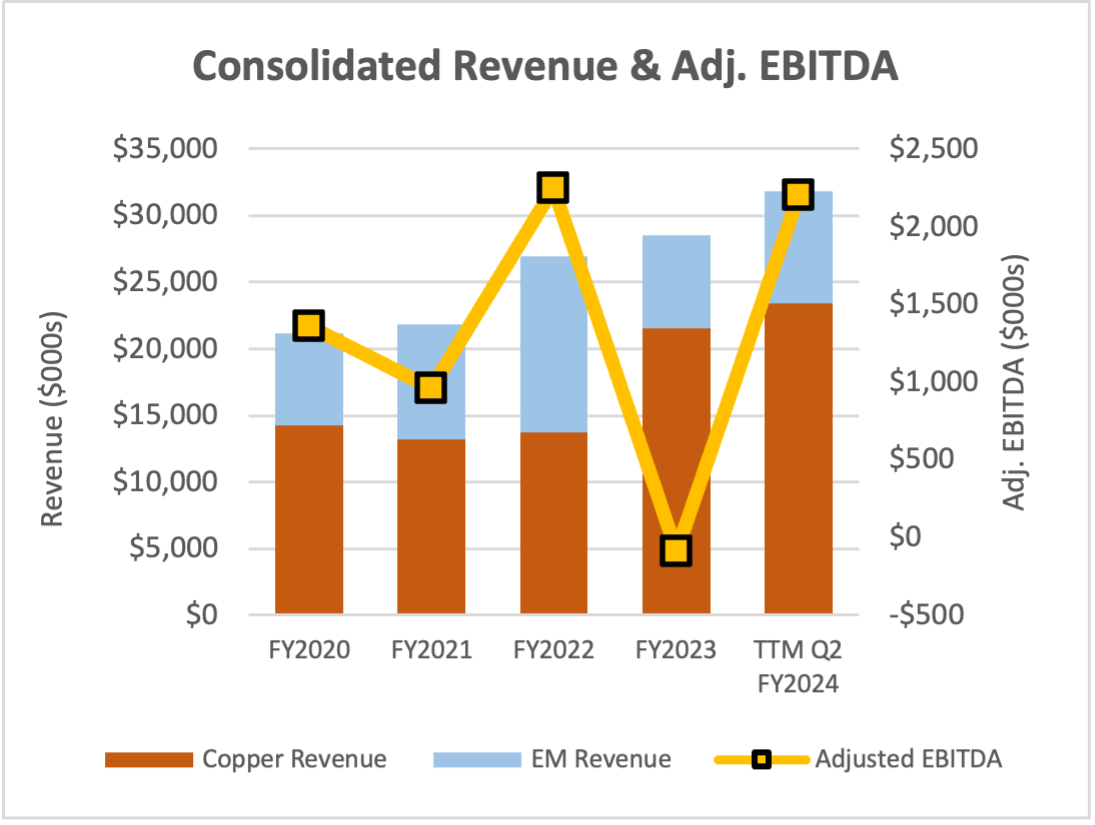
- On a consolidated basis, IBC booked net income of $712,000 or $0.01 per share, as compared to a loss of $394,000 or ($0.02) per share in the quarter ended December 31, 2023. Consolidated adjusted earnings before interest, taxes, depreciation, and amortization ("Adjusted EBITDA") [1] rose to $1.9 million in the quarter, as compared to Adjusted EBITDA in the comparable prior-year period of $673,000 and swung to positive adjusted EBITDA of $2.0 million in the six-month period ended December 31, 2022, as compared to adjusted EBITDA of ($269,000) in the comparable prior-year period.
- Operating income in the quarter of $1.5 million, and $1.14 million in the year to date, compared to $203,000 and ($1.2 million), respectively, in the comparable prior-year periods.
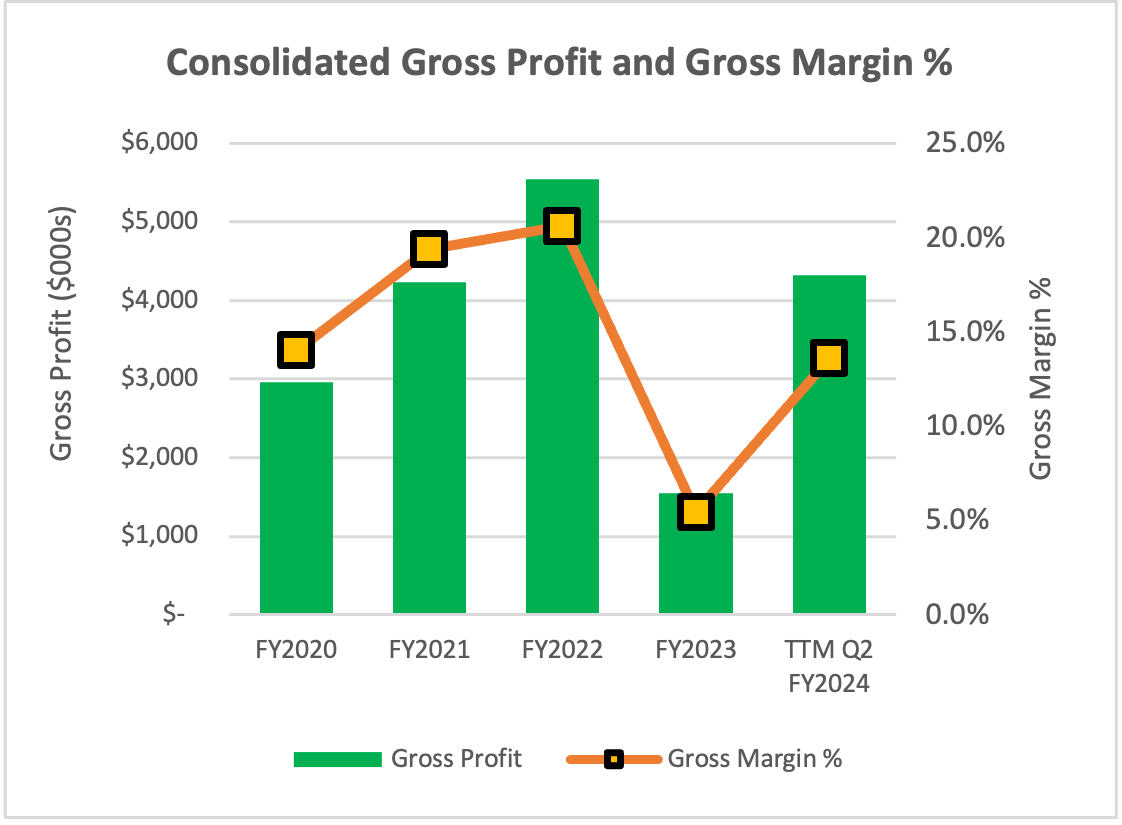
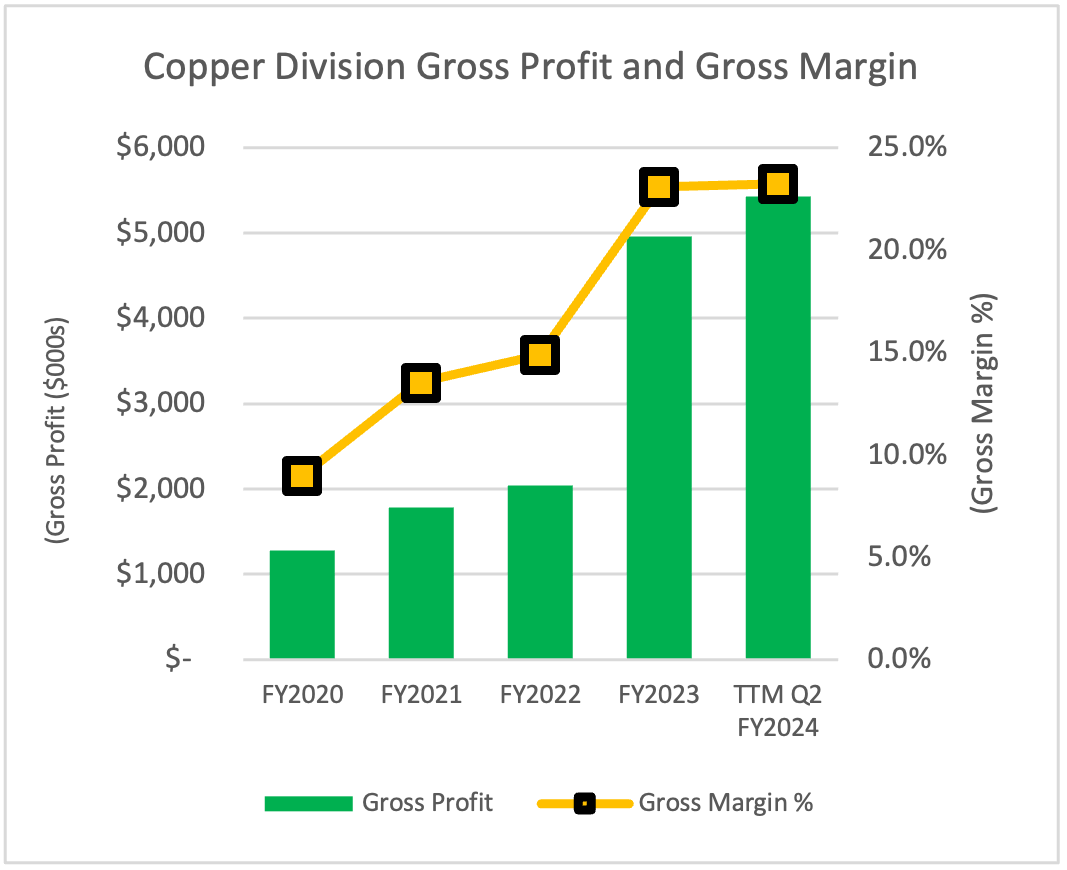
- Gross profit and gross margins in the quarter improved in both divisions, largely due to higher sales revenue as compared to the prior-year periods resulting in fixed costs forming a lower proportion of sales.
FRANKLIN, IN / ACCESSWIRE / February 13, 2024 / IBC Advanced Alloys Corp. (" IBC " or the " Company ") (TSXV:IB)(OTCQB:IAALF) announces its financial results for the quarter ended December 31, 2023.
IBC swing to profitability in the quarter, for the first time in seven quarters, recording net income of $712,000, or $0.01 per share, as compared to a loss of $394,000, or ($0.00) per share, in the quarter ended December 31, 2022. In the six-month period ended December 31, 2023, IBC booked a loss of $222,000 or ($0.00) per share, as compared to a loss of $2.4 million or ($0.03) in the comparable prior-year period. This performance was driven largely by increased sales and stronger gross margin performance in the Copper Alloys division, coupled with higher sales revenue from the Engineered Materials division of beryllium-aluminum products used in defense markets.
Consolidated sales rose to $10 million in the quarter, a 34.1% increase over the prior-year period, with both operating divisions booking significantly higher revenue driven by higher sales volumes and improved pricing. Gross profit and gross margins also improved across both divisions, as did operating income and Adjusted EBITDA.
"IBC's teams in both operating divisions did a fantastic job to close out calendar 2023 on a high note, and this has provided us with good additional momentum in 2024," said Mark A. Smith, Chairman and CEO of IBC. "Increased sales and stronger gross margin performance in the Copper Alloys division helped to lead the way in the quarter, and higher sales revenue from our Engineered Materials division of beryllium-aluminum alloy products for defense markets contributed significantly."
IBC is continuing to explore strategic options with potential partners, investors, and others regarding the Engineered Materials division and its Wilmington, Mass facility. These options include, but are not limited to, pursuit of additional contracts, joint ventures, restructuring, sale of assets, sale of the division, or closure of the division, and other possibilities. IBC will update the market as this effort progresses.
CONSOLIDATED RESULTS
| SELECTED RESULTS: Consolidated Operations ($000s) | |||||||||||||||||
| Quarter Ended 12-31-2023 | Quarter Ended 12-31-2022 | Six Months Ended 12-31-2023 | Six Months Ended 12-31-2022 | ||||||||||||||
Revenue | $ | 10,050 | $ | 7,495 | $ | 16,717 | $ | 13,423 | |||||||||
Operating income (loss) | $ | 1,472 | $ | 203 | $ | 1,138 | $ | (1,219 | ) | ||||||||
Adjusted EBITDA | $ | 1,902 | $ | 673 | $ | 2,021 | $ | (269 | ) | ||||||||
Income (loss) for the period | $ | 712 | $ | (394 | ) | $ | (222 | ) | $ | (2,408 | ) | ||||||
COPPER ALLOYS DIVISION
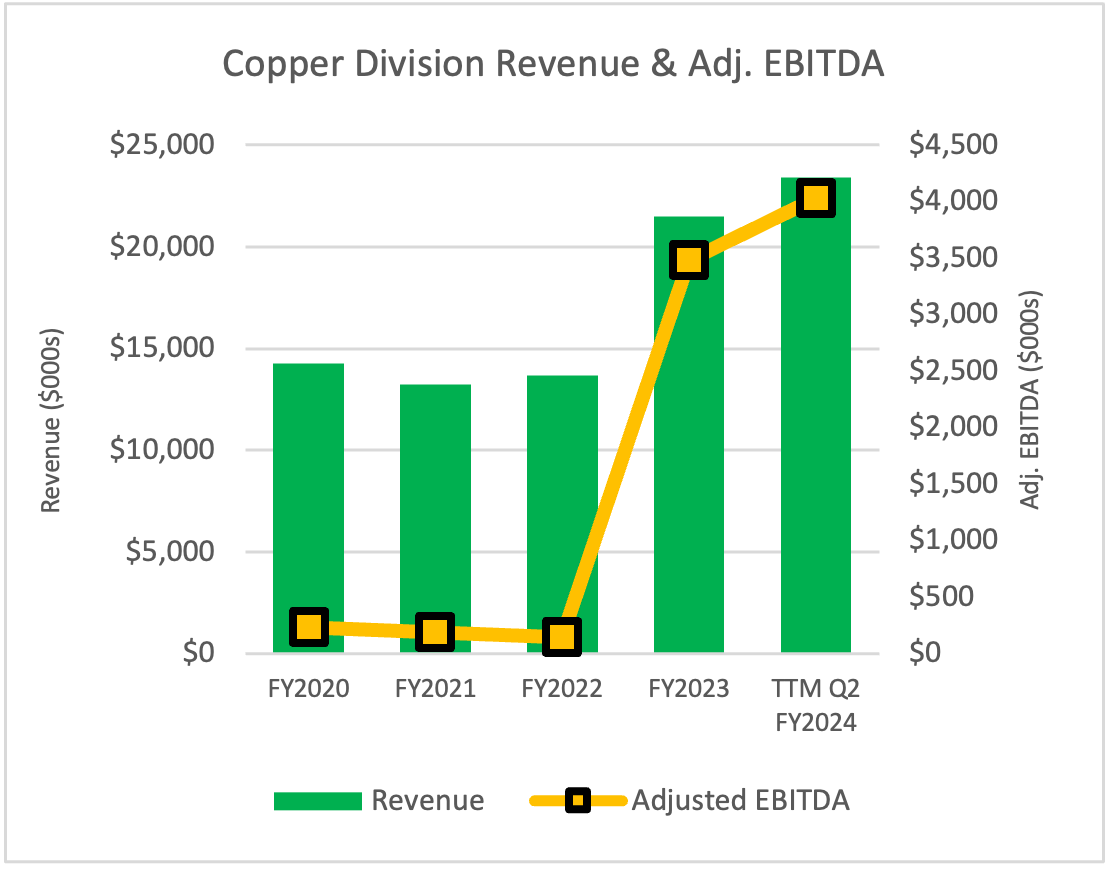
Sales increased the quarter and six-month period ended December 31, 2023, of Copper Alloys product lines mostly due to increased demand from customers in the defense and power generation sectors. Gross profit was positively impacted by improved material yield.
| SELECTED RESULTS: Copper Alloys Division ($000s) | |||||||||||||||||
| Quarter Ended 12-31-2023 | Quarter Ended 12-31-2022 | Six Months Ended 12-31-2023 | Six Months Ended 12-31-2022 | ||||||||||||||
Revenue | $ | 7,082 | $ | 5,708 | $ | 11,987 | $ | 10,110 | |||||||||
Operating income (loss) | $ | 1,136 | $ | 1,077 | $ | 1,473 | $ | 942 | |||||||||
Adjusted EBITDA | $ | 1,291 | $ | 1,216 | $ | 1,770 | $ | 1,220 | |||||||||
Income (loss) for the period | $ | 663 | $ | 921 | $ | 766 | $ | 691 | |||||||||
ENGINEERED MATERIALS DIVISION
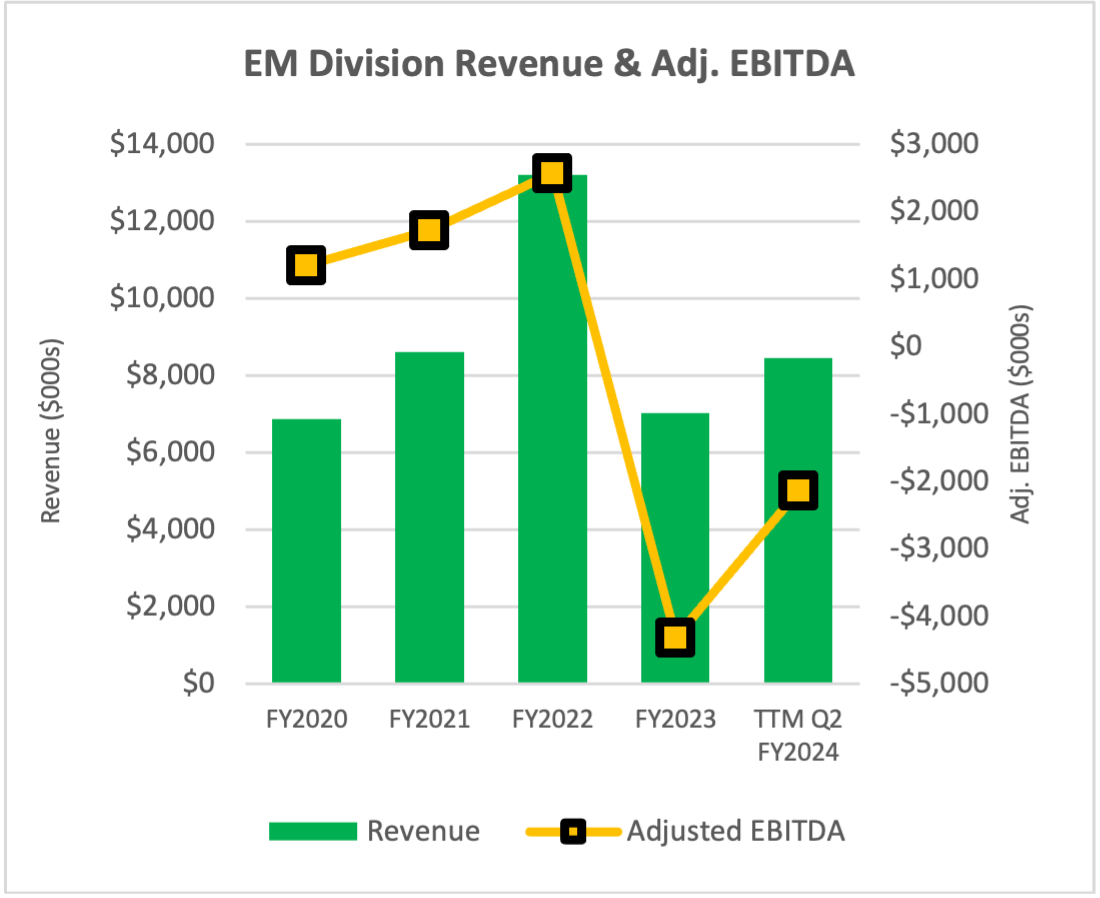
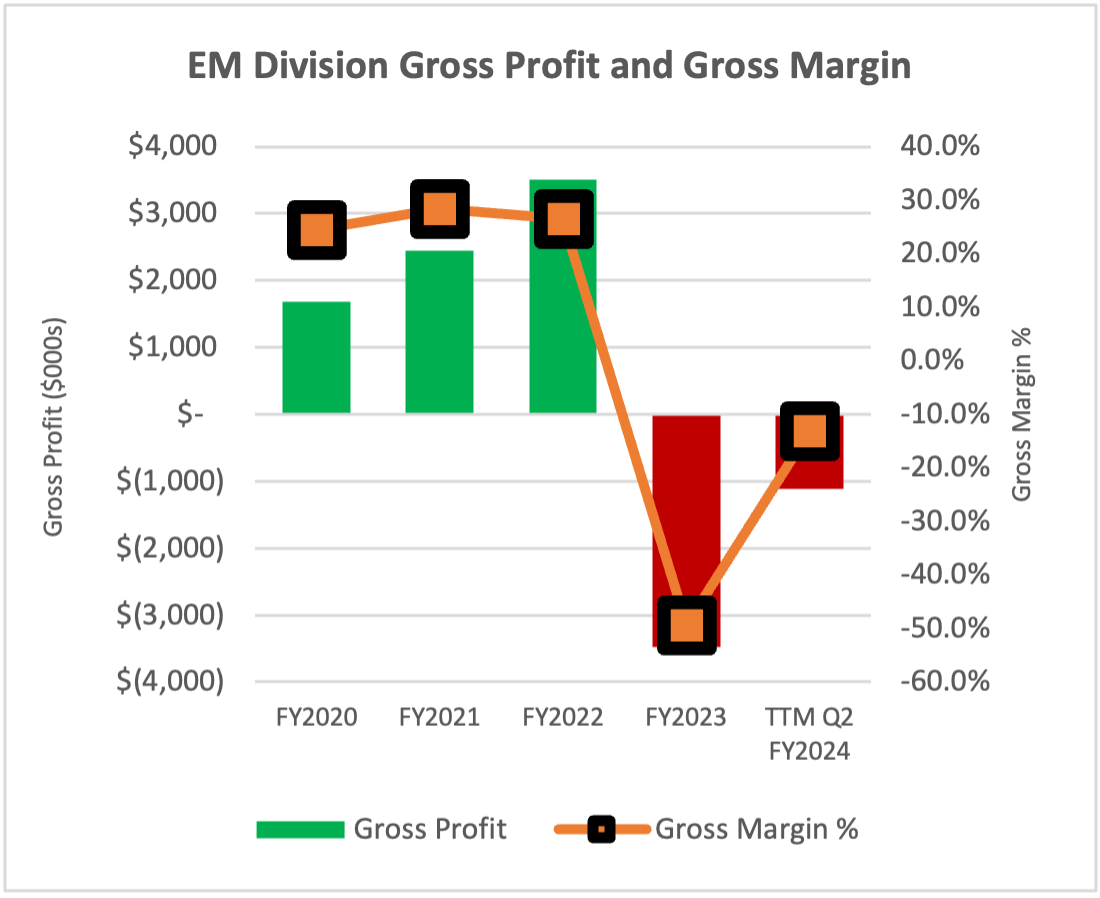
Sales increased in the quarter and six-month period ended December 31, 2023, largely due to more favorable product pricing in the defense markets. The division is continuing its efforts to improve yields. Gross margin improved from the comparable prior-year periods mostly due to higher sales in defense markets and improved yields on certain products and the reversal of the onerous contracts expense accrual as goods were shipped against related purchase orders.
| SELECTED RESULTS: Engineered Materials Division ($000s) | |||||||||||||||||
| Quarter Ended 12-31-2023 | Quarter Ended 12-31-2022 | Six Months Ended 12-31-2023 | Six Months Ended 12-31-2022 | ||||||||||||||
Revenue | $ | 2,968 | $ | 1,787 | $ | 4,730 | $ | 3,313 | |||||||||
Operating income (loss) | $ | 718 | $ | (739 | ) | $ | 388 | $ | (1,908 | ) | |||||||
Adjusted EBITDA | $ | 928 | $ | (469 | ) | $ | 815 | $ | (1,363 | ) | |||||||
Income (loss) for the period | $ | 563 | $ | (813 | ) | $ | 83 | $ | (2,042 | ) | |||||||
Full results can be seen in the Company's financial statements and management's discussion and analysis ("MD&A"), available at Sedar.ca and on the Company's website at https://ibcadvancedalloys.com/investors-center/.
INVESTOR WEBCAST SCHEDULED FOR FRIDAY, FEB. 16, 2024
We will host a live investor webcast on Friday, February 16, 2024, at 12 noon Eastern, featuring Mark A. Smith, CEO and Board Chairman, and Toni Wendel, Chief Financial Officer. They will discuss the Company's financial results for the quarter and six-month periods December 31, 2023. Participants must register in advance for the webcast here: https://us06web.zoom.us/webinar/register/WN_E9oPB8v7Tj22OwUPpMtXNQ
NON-IFRS MEASURES
To supplement its consolidated financial statements, which are prepared and presented in accordance with IFRS, IBC uses "operating income (loss)" and "Adjusted EBITDA", which are non-IFRS financial measures. IBC believes that operating income (loss) helps identify underlying trends in the business that could otherwise be distorted by the effect of certain income or expenses that the Company includes in loss for the period, and provides useful information about core operating results, enhances the overall understanding of past performance and future prospects, and allows for greater visibility with respect to key metrics used by management in financial and operational decision-making. The Company believes that Adjusted EBITDA is a useful indicator for cash flow generated by the business that is independent of IBC's capital structure.
Operating income (loss) and Adjusted EBITDA should not be considered in isolation or construed as an alternative to loss for the period or any other measure of performance or as an indicator of our operating performance. Operating income (loss) and Adjusted EBITDA presented here may not be comparable to similarly titled measures presented by other companies. Other companies may calculate similarly titled measures differently, limiting their usefulness as comparative measures to IBC's data.
OPERATING INCOME (LOSS)
Operating income (loss) represents income or loss for the quarter, and year to date, excluding foreign exchange loss, interest expense, interest income, other income (expense) and income taxes that the Company does not believe are reflective of its core operating performance during the periods presented. A reconciliation of the quarter and year-to-date loss to operating income (loss) follows:
Quarter ended December 31 | 2023 | 2022 | ||||||
| ($000s) | ($000s) | |||||||
Income (loss) for the period | 712 | (394 | ) | |||||
Foreign exchange (gain) loss | (3 | ) | 2 | |||||
Interest expense | 780 | 613 | ||||||
Loss on disposal of assets | - | - | ||||||
(Gain) loss on revaluation of derivative | - | (29 | ) | |||||
Other income | (21 | ) | 4 | |||||
Income tax expense (recovery) | 4 | 7 | ||||||
Operating income (loss) | 1,472 | 203 | ||||||
Six months ended December 31 | 2023 | 2022 | ||||||
| ($000s) | ($000s) | |||||||
Loss for the period | (222 | ) | (2,408 | ) | ||||
Foreign exchange (gain) loss | 1 | 8 | ||||||
Interest expense | 1,420 | 1,233 | ||||||
Loss on disposal of assets | - | - | ||||||
(Gain) loss on revaluation of derivative | 1 | (59 | ) | |||||
Other income | (66 | ) | 4 | |||||
Income tax expense (recovery) | 4 | 3 | ||||||
Operating income (loss) | 1,138 | (1,219 | ) | |||||
ADJUSTED EBITDA
Adjusted EBITDA represents our income (loss) for the period, and year to date, before interest, income taxes, depreciation, amortization, and share-based compensation. A reconciliation of the quarter and year-to-date loss to Adjusted EBITDA follows:
Quarter ended December 31 | 2023 | 2022 | ||||||
| ($000s) | ($000s) | |||||||
Income (loss) for the period | 712 | (394 | ) | |||||
Income tax expense (recovery) | 4 | 7 | ||||||
Interest expense | 780 | 613 | ||||||
(Gain) loss on revaluation of derivative | - | (29 | ) | |||||
Depreciation, amortization, & impairment | 373 | 409 | ||||||
Stock-based compensation expense (non-cash) | 33 | 67 | ||||||
Adjusted EBITDA | 1,902 | 673 | ||||||
Six months ended December 31 | 2023 | 2022 | ||||||
| ($000s) | ($000s) | |||||||
Loss for the period | (223 | ) | (2,408 | ) | ||||
Income tax expense (recovery) | 4 | 3 | ||||||
Interest expense | 1,420 | 1,233 | ||||||
(Gain) loss on revaluation of derivative | 1 | (59 | ) | |||||
Depreciation, amortization, & impairment | 746 | 819 | ||||||
Stock-based compensation expense (non-cash) | 73 | 143 | ||||||

