par Troy Minerals Inc. (isin : CA8974711084)
Troy Minerals Reports Analytical Results from Table Mountain Silica Project, Identifying Broad High-Purity Zones
VANCOUVER, BC / ACCESS Newswire / February 6, 2025 / Troy Minerals Inc. ("Troy" or the "Company") (CSE:TROY)(OTCQB:TROYF)(FSE:VJ3) is pleased to announce that it has received results from a sampling and mapping program on its 100% owned Table Mountain Silica Project, located near Golden, British Columbia, Canada.
Key Highlights
Three distinct zones of high-purity silica mineralization identified within the Mount Wilson Quartzite Formation.
98.86% SiOâ over a total of 62.11 metres of channel sampling in five channels at the main Table Mountain Zone.
Outcrop sampling returned 98.18% to 99.74% SiO2 from 45 samples at Table Mountain Zone, 97.83% to 99.49% SiOâ from 13 samples at South Zone, and 95.82% to 99.82% SiOâ from 29 samples at Southeast Zone. *
Very low deleterious elements identified in all samples.
President of Troy Minerals Inc., Yannis Tsitos commented: "These comprehensive maiden assay results validate the potential of Table Mountain as a key high-purity silica asset. Sampling confirmed the exceptional quality and consistency of silica mineralization across the Project. With grades reaching 98 to 99% SiOâ across multiple zones of extensive outcrop exposure, and sampling ranging from 98.18% to 99.74% SiOâ at the main Table Mountain Zone, we are rapidly advancing our understanding of this strategic asset. The Project's infrastructure advantages and proximity to existing silica operations further enhance its potential as we work to establish Troy as a significant player in the North American high-purity silica market, positioning the Company for long-term growth."
The sampling program consisted of both systematic grab samples and channel samples, with a total of 110 grab samples (107 outcrop and 3 float) taken within the property area and 70 channel samples collected from 62.11 metres within 74.16 metres of channels.
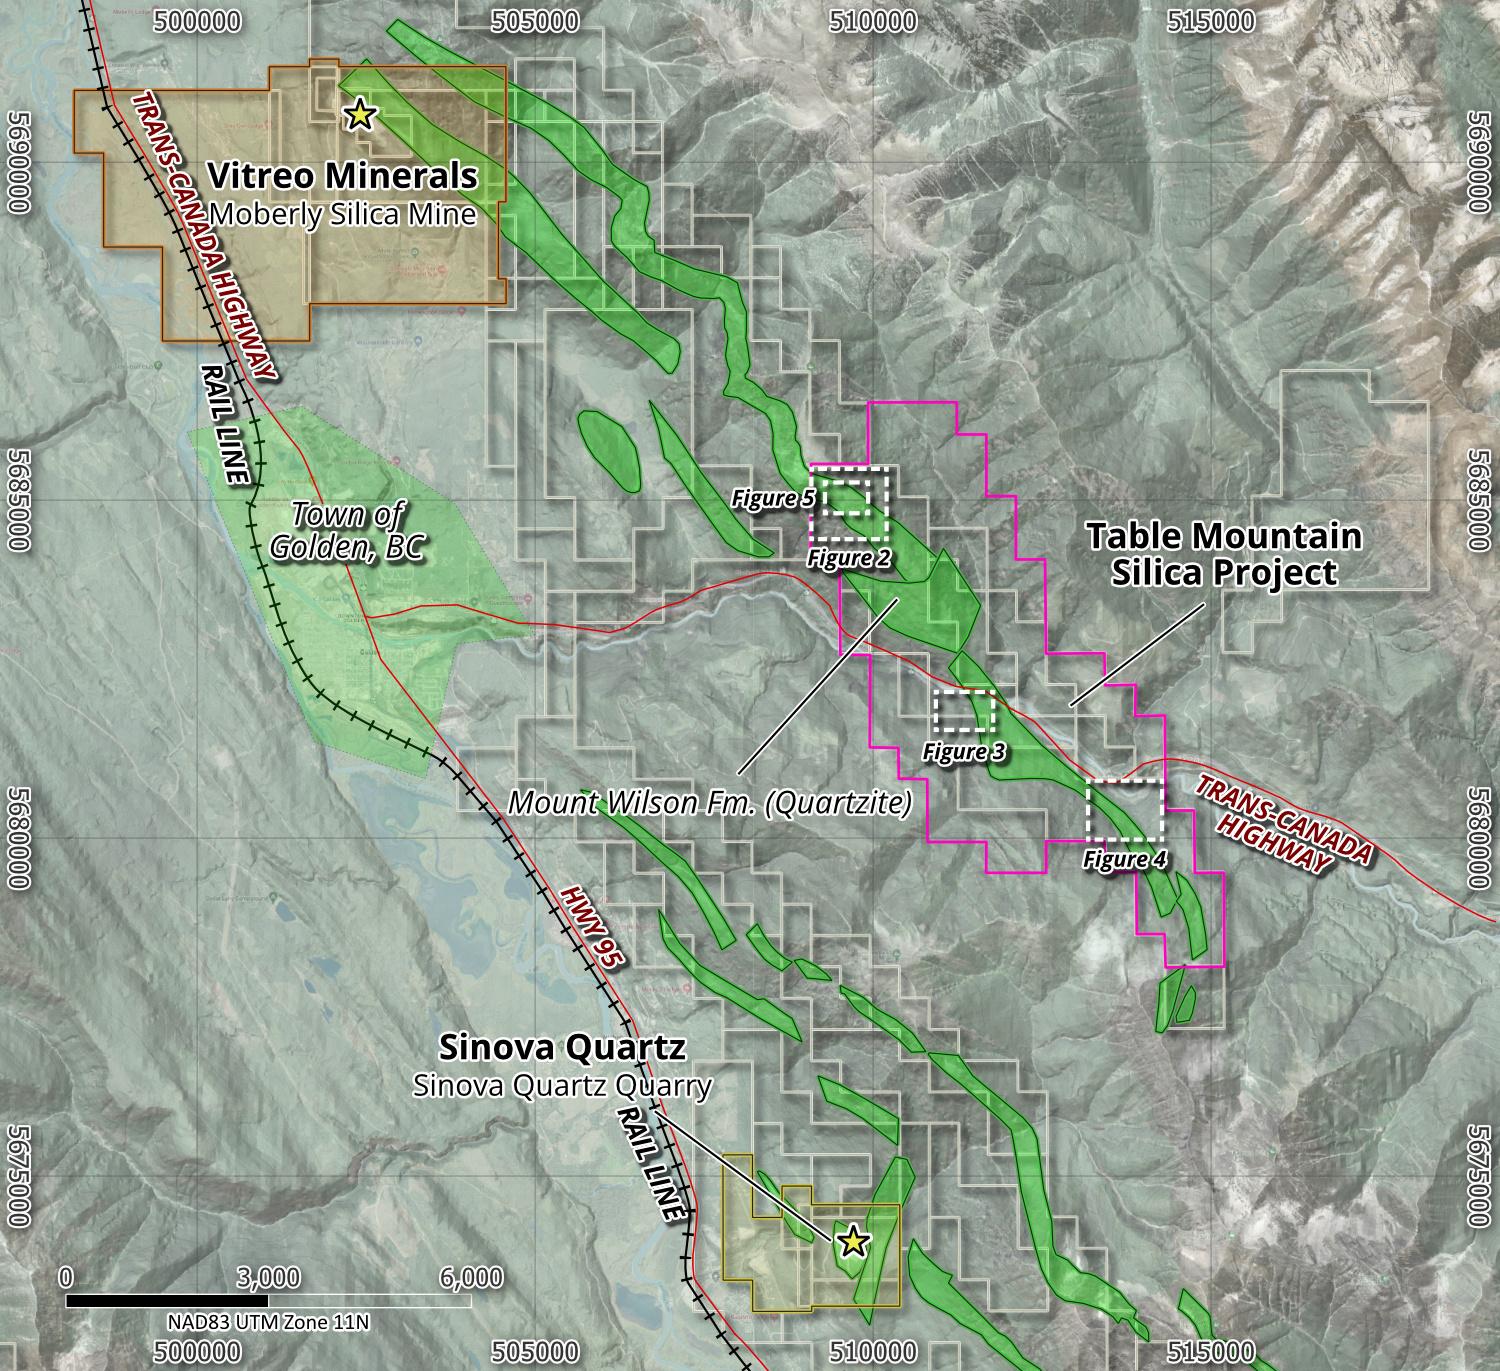
Figure 1. Index Map
Outcrop Sampling Results
Three main areas returned significant high-purity silica results: the Table Mountain Zone, located at the north end of the Property, the South Zone, and the Southeast Zone.
The most extensively sampled zone was the Table Mountain Zone, which returned an average grade of 98.90% SiOâ from 45 grab samples (42 outcrop, 3 float), with values ranging from 98.18% to 99.74% SiOâ. Additionally, from these samples the following average values were returned: 0.31% FeâOâ, 0.01% CaO, 0.14% AlâOâ, 0.02% MgO, 0.01% TiOâ, 0.01% PâOâ , and 14ppm boron. See Figure 2 and Table 1. *
Figure 2. Table Mountain Zone Outcrop Sampling - %SiO2
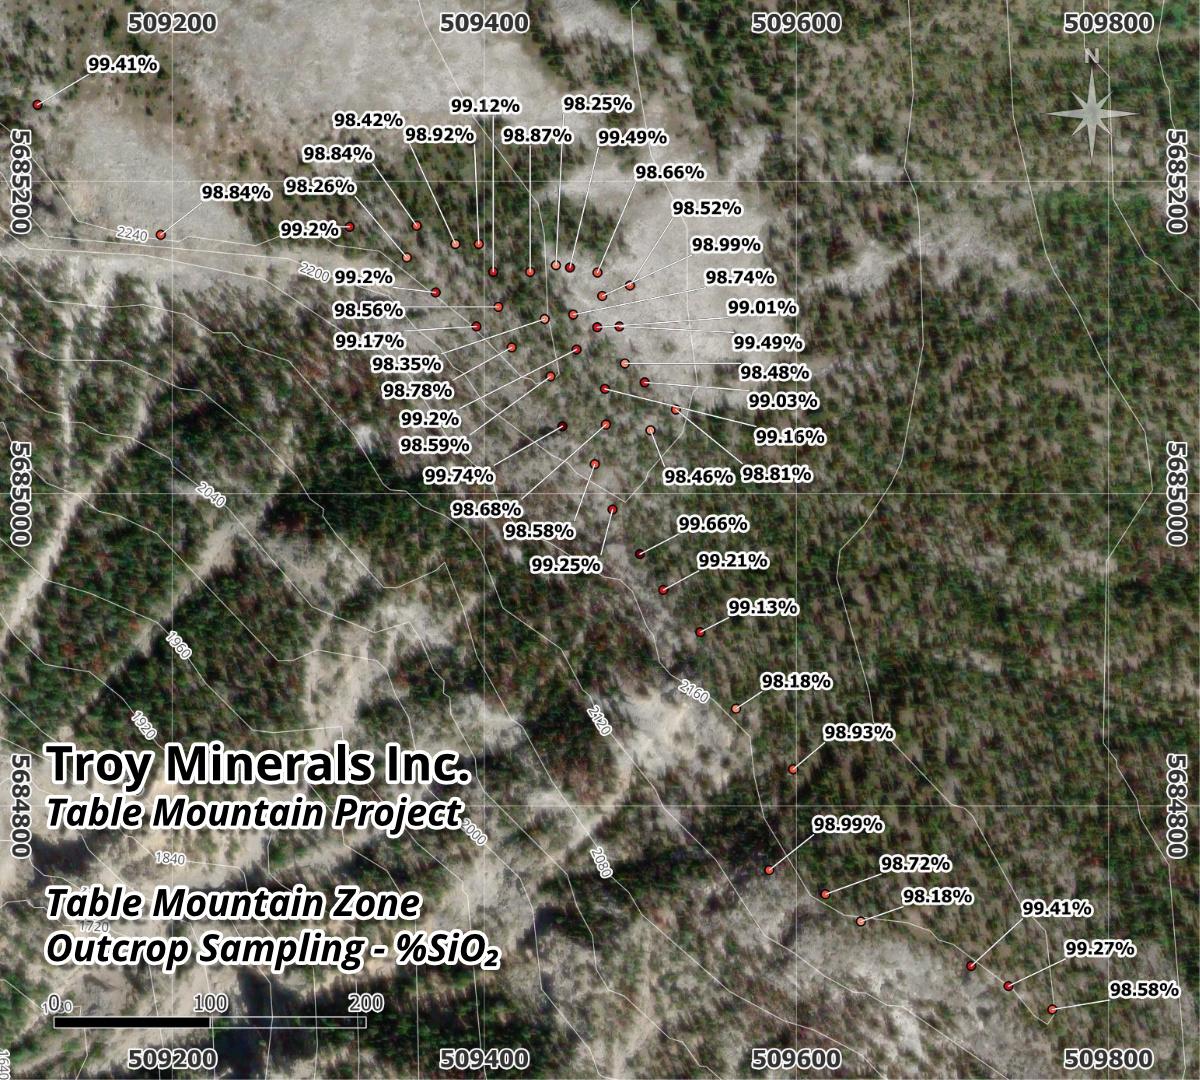
Table 1. Table Mountain Zone Outcrop Samples
Sample # | Easting (m) | Northing (m) | SiO2 (%) | Al2O3 (%) | CaO (%) | Fe2O3 (%) | MgO (%) | P2O5 (%) | TiO2 (%) | B (ppm) |
299516 | 509114 | 5685249 | 99.41 | 0.11 | 0.02 | 0.39 | 0.01 | <0.01 | <0.01 | 6 |
299517 | 509193 | 5685166 | 98.84 | 0.14 | 0.01 | 0.23 | 0.02 | <0.01 | <0.01 | 8 |
299518 | 509314 | 5685171 | 99.20 | 0.10 | 0.01 | 0.25 | 0.02 | <0.01 | 0.01 | 10 |
299519 | 509350 | 5685151 | 98.26 | 0.12 | 0.01 | 0.35 | 0.01 | <0.01 | 0.01 | 15 |
299520 | 509369 | 5685129 | 99.20 | 0.13 | 0.01 | 0.21 | <0.01 | <0.01 | 0.03 | 16 |
299521 | 509395 | 5685107 | 99.17 | 0.15 | 0.01 | 0.27 | 0.02 | <0.01 | 0.01 | 8 |
299522 | 509418 | 5685094 | 98.78 | 0.23 | 0.02 | 0.26 | 0.01 | <0.01 | 0.01 | 12 |
299523 | 509442 | 5685075 | 98.59 | 0.14 | 0.02 | 0.26 | <0.01 | 0.01 | 0.01 | 12 |
299524 | 509450 | 5685043 | 99.74 | 0.07 | 0.01 | 0.30 | 0.01 | 0.01 | 0.01 | 6 |
299525 | 509471 | 5685019 | 98.58 | 0.04 | 0.01 | 0.36 | 0.01 | 0.01 | 0.01 | 7 |
299526 | 509482 | 5684990 | 99.25 | 0.14 | 0.02 | 0.27 | 0.04 | 0.01 | 0.01 | 7 |
299527 | 509500 | 5684961 | 99.66 | 0.16 | 0.02 | 0.31 | 0.02 | 0.01 | 0.01 | 7 |
299528 | 509515 | 5684938 | 99.21 | 0.14 | 0.01 | 0.32 | 0.02 | 0.01 | 0.01 | 7 |
299529 | 509538 | 5684911 | 99.13 | 0.11 | 0.01 | 0.27 | 0.03 | 0.01 | 0.01 | 21 |
299530 | 509561 | 5684862 | 98.18 | 0.25 | 0.01 | 0.31 | 0.03 | 0.01 | 0.01 | 7 |
299531 | 509598 | 5684823 | 98.93 | 0.27 | 0.02 | 0.36 | 0.03 | 0.01 | 0.01 | 7 |
299532 | 509583 | 5684759 | 98.99 | 0.09 | 0.01 | 0.30 | <0.01 | 0.01 | 0.01 | 7 |
299533 | 509619 | 5684743 | 98.72 | 0.16 | 0.01 | 0.35 | 0.02 | 0.01 | 0.01 | 14 |
299534 | 509641 | 5684726 | 98.18 | 0.30 | 0.01 | 0.33 | 0.04 | 0.01 | 0.02 | 15 |
299535 | 509712 | 5684697 | 99.41 | 0.13 | 0.01 | 0.30 | 0.02 | 0.01 | 0.01 | 7 |
299536 | 509736 | 5684685 | 99.27 | 0.11 | 0.01 | 0.33 | 0.02 | 0.01 | 0.01 | 7 |
299537 | 509764 | 5684670 | 98.58 | 0.13 | 0.02 | 0.36 | 0.03 | 0.01 | 0.02 | 8 |
299548 | 509306 | 5685510 | 99.32 | 0.14 | 0.01 | 0.29 | 0.01 | 0.01 | 0.01 | 18 |
299560 | 509476 | 5685127 | 98.99 | 0.13 | 0.01 | 0.32 | 0.03 | 0.01 | 0.02 | 27 |
299561 | 509472 |